Every vendor sells the same diagram. Almost nobody explains which parts you can skip, which order to build them in, or what it costs when you get the sequence wrong.

Key takeaways
- The stack has six layers, but a first release only needs four of them.
- Choose the warehouse before the ingestion tool — data gravity dictates everything downstream.
- A semantic layer added late costs three times what it costs added early.
- Ninety days is enough for one governed data mart in production, and nothing more. Plan accordingly.
What the stack actually is
Strip away the logos and the modern data stack is six layers stacked in one direction: ingestion, storage, transformation, orchestration, semantics and observability. Data enters at the bottom, becomes trustworthy somewhere in the middle, and becomes decisions at the top. Every product on the market claims one or more of those layers; a surprising number claim all six, and none of them are equally good at all six.
The reason architecture diagrams are so unhelpful is that they present the six layers as equally necessary from day one. They are not. In an eleven-year run of warehouse projects, the pattern that separates the programmes that deliver from the ones that stall is not tool choice. It is the order in which the layers were built, and the honesty of the scope in the first release.
More than half of all development work for data warehousing projects is typically dedicated to the design and implementation of ETL processes. If you have not budgeted for that, you have not budgeted.
Layer by layer, with the trade-offs
Storage — decide this first
Counter-intuitively, the warehouse or lakehouse is the first decision, not the last. It sets the SQL dialect your transformations will be written in, the concurrency model your BI layer inherits, the cost curve finance will be looking at in eighteen months, and — most importantly — where your data gravity sits. Once a few terabytes land somewhere, moving them becomes a programme in its own right.
The practical questions, in the order they matter:
- Where does the data already live? If 80% of your source systems are in one cloud, egress economics will push you to that cloud's warehouse whether or not it is the best product.
- What is your concurrency profile? Two hundred analysts running ad-hoc queries at 09:00 is a very different workload from twelve scheduled dashboards refreshing overnight.
- Do you need to separate storage and compute? If your load is spiky, yes, emphatically. If it is flat, the premium buys you less than the marketing suggests.
- What is the exit cost? Ask the vendor to quote it. The answer, and the willingness to answer, are both informative.
Ingestion — buy before you build
Writing connectors is the least differentiated engineering work in the entire stack. A managed ingestion tool that covers 70% of your sources for a predictable fee is almost always cheaper than the fully loaded cost of maintaining those connectors internally — including the schema-change incidents that happen at 03:00 on a Sunday.
Build custom ingestion only for the sources that are genuinely yours: an internal event stream, a proprietary application database with unusual semantics, a partner feed with a bespoke contract. For everything else — Salesforce, NetSuite, Workday, Stripe, the usual estate — buy it and move on.
The one thing to insist on regardless of build or buy is a data contract at the boundary: an explicit, versioned statement of the schema, the freshness guarantee and the semantics of each field. Contracts are what turn a silent upstream change from a week of confused debugging into a failed pipeline run with a clear error message.
Transformation — where the value is
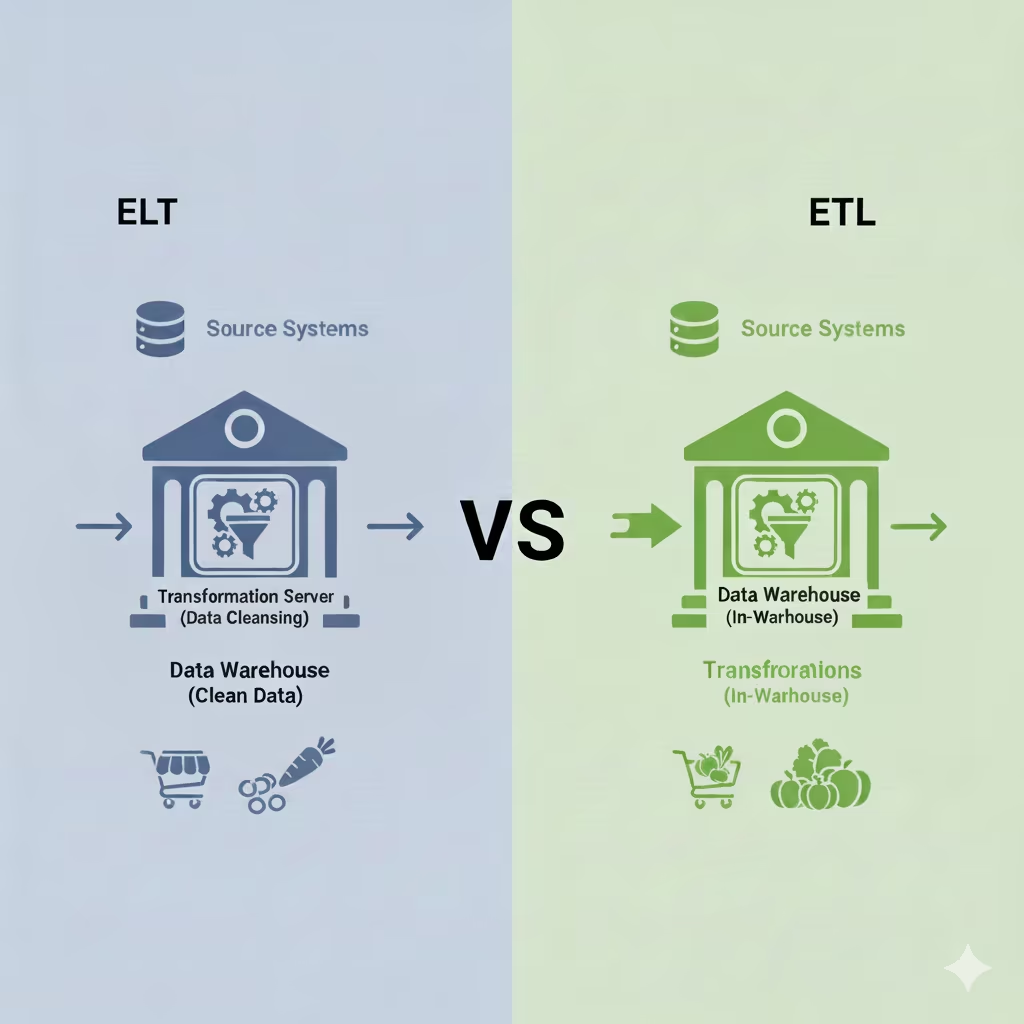
This is the layer that turns raw extracts into something a human can reason about, and it is where most of the intellectual work of the programme lives. The industry has largely converged on ELT — land the raw data first, transform it inside the warehouse — for good reasons: the warehouse is elastic, the transformations are versioned SQL rather than opaque GUI flows, and the raw layer gives you a replay capability when logic changes.
Structure the transformation layer in three tiers and resist the temptation to collapse them:
- Staging. One model per source table. Rename, cast, deduplicate. No business logic. Ever.
- Intermediate. Joins, denormalisation and the genuinely hard business rules — the ones that need a comment explaining why, not what.
- Marts. Conformed dimensions and facts, shaped for consumption, tested and documented.
The discipline that pays for itself fastest is testing. Not sophisticated statistical testing — simply asserting that primary keys are unique and not null, that foreign keys resolve, that a column expected to hold five values holds five values. In practice these catch the overwhelming majority of upstream breakages, and they cost minutes to write.
Orchestration — later than you think
You do not need a distributed workflow engine to run four jobs. A scheduler that runs the ingestion tool, then the transformation project, then a freshness check, is sufficient for a surprisingly long time. Introduce full orchestration when you have genuine cross-system dependencies, backfill requirements or SLAs that need per-task retry semantics — not because the reference architecture has a box for it.
Semantics — the layer everyone adds too late
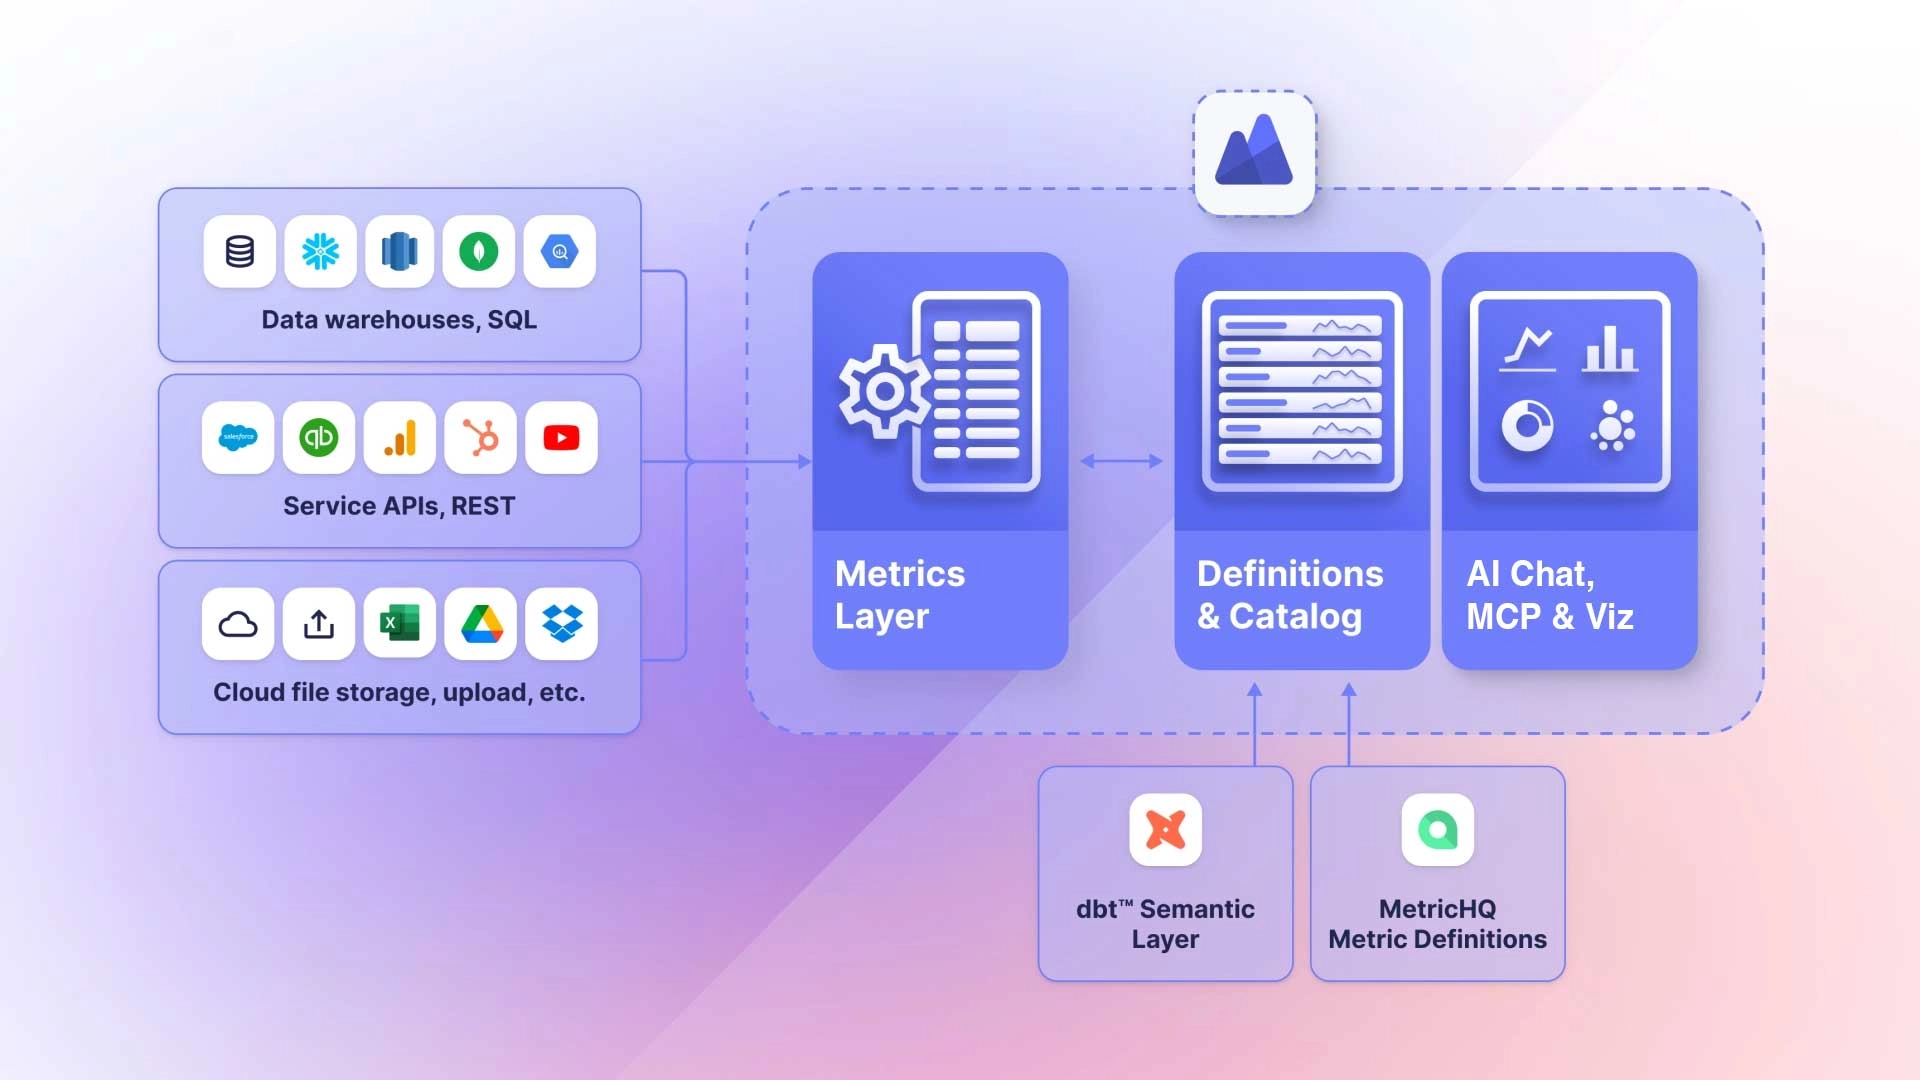
The semantic layer is where a metric gets exactly one definition. What is active customer? What counts as revenue, and at which point in the order lifecycle? Without a semantic layer these definitions live in individual dashboards, and within a year you have four numbers for the same question and a quarterly meeting to reconcile them.
Adding semantics early is cheap: you define the metrics as you build the marts. Adding it late means auditing every existing dashboard, negotiating the differences with the people who built them, and migrating consumers who have grown attached to their version of the truth. We have costed this both ways on real programmes. Retrofitting runs about three times the effort of doing it inline.
Observability — the cheapest insurance available
Data observability answers three questions: is the data fresh, is the volume what we expected, and has the distribution shifted in a way that suggests something upstream changed? You can buy sophisticated tooling for this. You can also get 80% of the value from a handful of scheduled checks that write to a table and alert a channel — freshness by source, row-count deviation against a trailing average, and null-rate by critical column.
What you can safely skip in release one
A first release does not need orchestration beyond a scheduler, and does not need a reverse-ETL layer at all. It does not need real-time streaming unless a named business process genuinely cannot function on a daily refresh — and in our experience roughly one in six requests for real-time survives being asked which decision changes as a result.
It also does not need every source system. The instinct to onboard everything at once is the single most reliable predictor of a data programme that delivers nothing in its first year.
A ninety-day rollout that actually lands
Here is the plan we run, adapted per client but rarely restructured. The unit of success is one governed data mart in production, used by real people, for a decision that matters.
| Phase | Days | Outcome |
|---|---|---|
| Discovery and profiling | 1–14 | Source inventory, quality profile, and a prioritised backlog where every item names the decision it improves. |
| Platform foundation | 15–30 | Warehouse provisioned, access model in place, ingestion running for the first three sources, CI pipeline for transformations. |
| Raw to staging | 31–45 | Staging models with tests for every landed table. Freshness monitoring live. |
| Business logic | 46–70 | Intermediate models and the first conformed dimensions. Metric definitions agreed in writing with the business owner. |
| Mart and consumption | 71–85 | The mart, the semantic definitions, and one dashboard that answers the original question. |
| Handover | 86–90 | Runbook, on-call rota, documented backlog for release two. Team can operate it without us. |
Two things about this plan generate the most pushback, and both are load-bearing. The first is that discovery takes a full two weeks with no visible output but a document. The second is that only three sources are onboarded. Every time a client has compressed the first or expanded the second, the ninety days ended with a platform and no users.
The four failure modes we see most often
- Tool-first sequencing. The stack is selected before anyone has profiled the data. The profile then reveals that the hard problem is source quality, which no tool solves.
- The everything-release. Scope covers all source systems and all reporting domains. Eighteen months in, nothing is in production and the sponsor has moved roles.
- Semantics deferred. Metrics are defined in the BI tool by whoever built the dashboard. By the time this is recognised as a problem, there are two hundred dashboards.
- No named business owner. The programme is owned by IT alone. Without a business owner who will use the output and defend the metric definitions, the warehouse becomes an expensive copy of the source systems.
What good looks like at day ninety
A named business owner runs their weekly meeting from a dashboard that reads from a governed mart. Every metric in it has one written definition. If a source system changes its schema overnight, a test fails and someone is told before the business sees a wrong number. The team that built it can add the fourth source without calling anyone.
That is a smaller outcome than the diagram promises, and it is far more valuable than a fully built six-layer stack with no users. Everything after day ninety is repetition of a proven pattern — which is exactly the position you want to be in.
Frequently asked questions
For analytics on structured business data, start with a warehouse — the governance, testing and semantic tooling is far more mature. Add lake storage when you have genuine volumes of semi-structured or unstructured data that would be uneconomic to hold in a warehouse. The lakehouse pattern lets you converge later without redoing the first decision.
A first governed mart can be built and operated by two to three people: an analytics engineer, a data engineer, and a part-time platform owner. The number grows with the number of source domains, not with data volume.
Only where a named decision changes because of it. Ask which action a person or system takes differently at five minutes latency versus twenty-four hours. Roughly one request in six survives that question.